This reading covers how you can create dashboards in Google Ads to monitor the metrics you’re most interested in viewing.
Google Ads dashboards
The Google Ads Overview page features a standard dashboard to monitor key advertising metrics. You can also create additional dashboards. In any new dashboard, you can add scorecards, charts and tables from reports, and notes if you’re collaborating with others on a project.
Dashboard examples
Click the following links to view dashboard examples in the Data Studio Report Gallery:
- Account health: These are examples of dashboards for account health and include views of overall account performance and performance of individual campaigns such as search, display, video, shopping, and mobile app campaigns.
- Ad group performance: This is an example of a dashboard with selectable options to display the performance metrics for a campaign, campaign type, ad group, or device.
- Performance by day: This example is similar to the ad group performance dashboard example, but displays the metrics for each day.
- Insights by ad type: This is an example of a dashboard with selectable options to display the clicks and click through rate (CTR) for responsive search and expanded text ads for a campaign, ad group, or device.
- Keyword performance: This is an example of a dashboard with selectable options to display the conversion rates and keyword matches for a campaign, match type, ad group, or device.
Steps to create a dashboard
To create a new dashboard in Google Ads, complete the following steps:
- Sign in to your Google Ads account.
- Click the Reports icon.
- Select Dashboards.
- To create a new dashboard, click the plus icon.
Scorecards
Scorecards are commonly used to visualize key performance indicators on a dashboard.
Note: Scorecards on the Google Ads Overview page are different from the cards that are on the Recommendations page. Refer to the View and apply recommendations in Google Ads reading in this course for more information about the cards on the Recommendations page.
Scorecard examples
The following are examples of scorecards displayed in the Overview page.
Devices scorecard showing cost, conversion value, and clicks for each device type.

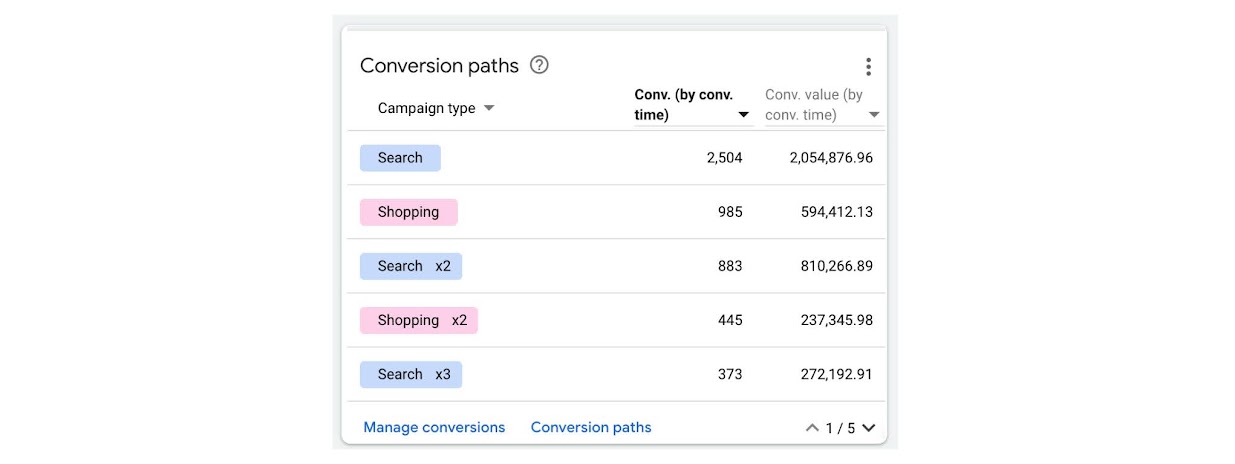
Conversion paths scorecard showing conversions and conversion value by campaign type.
Steps to add a scorecard to a dashboard
To add a scorecard to a dashboard, complete the following steps:
- From the dashboard, click the plus icon.
- Click the Score card icon above the dashboard.
- Enter a name and description for the scorecard.
- Choose the measures you want to include.
- (Optional) Enter a filter you’d like to add to the data.
- (Optional) Add conditions for conditional formatting.
- (Optional) Customize the data shown in your scorecard by checking the boxes to include items like a Sparklines chart, percent change, and absolute change.
- Click Add.
Reports
You can also create a table or chart using the built-in Report Editor, and then add the table or chart to a dashboard.
Steps to add a table or chart to a dashboard
To add a table or chart to a dashboard, complete the following steps:
- From the dashboard, click the plus icon.
- Click the Reports icon above the dashboard.
- Select Report and then select Create Report.
- Click Create Report and select Table to create a table or select the type of chart you want to create:
- Bar
- Column
- Time Series
- Pie
- Scatter
- Drag and drop a dimension into a labeled section. The dimension you select determines the metrics available in the next step.
- Drag and drop metrics, such as Clicks or Conversions, into a labeled section to include the data in the table or chart.
- Name your report, and click Save.
- (Optional) Enter a description for the report.
- Click Apply.
Resources for more information
For more information about creating, editing, and adding a dashboard, scorecard, or report in Google Ads, refer to the following resources:
- Dashboard: Definition: Describes dashboard functionality and features
- Create and edit dashboards: Provides instructions to create a dashboard and add a scorecard or custom report to it
- Create custom reports in Report Editor: Provides instructions to create a custom report that you can add to a dashboard