This reading provides more details about benefits to link a Google Ads account to Google Analytics and what marketers gain from them.
- Better understand the marketing funnel
- Better define audiences for remarketing
Better understanding of the marketing funnel
Google Analytics can be thought of as a single pane of glass. This term is sometimes used to describe a software product that offers an integrated way to view data. After accounts are linked, you can use your Google Analytics account as a central place to view and analyze metrics from Google Ads. This centralization is helpful when you are trying to understand how potential customers proceed through the marketing funnel. To access linked advertising metrics in Google Analytics, click the Advertising icon in the navigation panel.
Google Analytics Advertising snapshot menu options, including Model comparison, and Conversion paths under Attribution.

Advertising snapshot
The Advertising snapshot contains data panes labeled with specific questions that are aligned with certain stages of the marketing funnel:
- Which channels drive the most conversions? (Conversion)
- What touchpoints do customers take to convert? (Consideration and Conversion)
- How do your channels perform under a different attribution model? (Conversion)
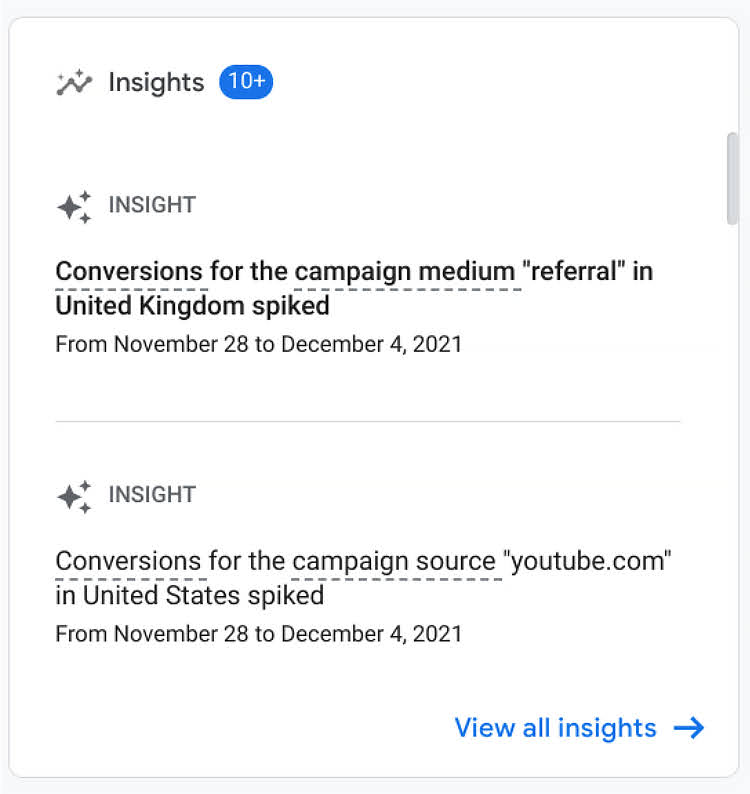
Another pane in the Advertising snapshot enables you to view insights identified by Google Analytics, such as conversion spikes for campaigns as shown below.
Insights pane in the Advertising snapshot with individual insights identified by Google Analytics. Insights pane in the Advertising snapshot with individual insights identified by Google Analytics.
Model comparison
In the video about linked metrics, you learned how you can compare attribution models in Google Analytics after you link a Google Ads account. When you select Model comparison from the Attribution menu, you can view a side-by-side comparison of conversions from different touchpoint perspectives. This is helpful to gain a more refined understanding of the marketing funnel.
Cross-channel models attribute a percentage of a conversion to all advertising channels with touchpoints. Cross-channel models use one of the following rules to give credit for a conversion:
- Data-driven: Attributes conversions based on historical data about how people searched for your business and interacted with your ads. Data-driven attribution looks at the entire customer journey that leads a user to convert and allocates conversion credit to each step in that journey.
- Last click: Attributes 100% of the conversion to the last channel that a customer clicked through or engaged with before converting.
- First click: Attributes 100% of the conversion to the first channel that a customer clicked through or engaged with before converting.
- Linear: Distributes attribution for a conversion equally across all channels a customer clicked through or engaged with before converting.
- Position-based: Attributes 40% of a conversion to the first channel, 40% of a conversion to the last channel, and attributes the remaining 20% equally among the other touchpoints in between.
- Time decay: Attributes a conversion to each channel based on a 7-day half-life scale. In other words, a click through a channel eight days before a conversion gets half as much credit as a click one day before a conversion.
Note: As of January 26, 2022, Google Analytics 4 properties have cross-channel data-driven attribution enabled as the default model.
The Ads-preferred model attributes 100% of a conversion to the last Google Ads channel that the customer clicked through before converting.
The model you choose to view metrics with depends on the kinds of questions you’re trying to answer. Suppose you want to know how your display and search ad campaigns are impacting each other. You could view the number of conversions for each channel in side-by-side comparisons using the first-click and last-click models. If the number of conversions in each model are proportionally the same, the campaigns probably aren’t impacting each other. However, if the display channel has significantly more conversions in the first-click model than in the last-click model, it might be worth investigating how many times a display ad is a first or middle touchpoint before a last-click search ad conversion is made. To investigate further, you can look at the data for conversion paths.
Conversion paths
Conversion paths enable you to view first and last touchpoints before conversion, and touchpoints in between. For example, if you examine the conversion path in row 29 below, users performed a search, clicked a referred link, and searched again before making a purchase.
Conversion paths for the Google Merchandise Store in Google Analytics, including multiple touchpoints for Organic search and Referral.

In the previous scenario given for model comparison, the display channel had significantly more conversions in the first-click model than the last-click model. In the conversion paths, you could investigate further by finding all instances of Display. This would enable you to better understand the impact that display ads have on search ad conversions.
Better definition of audiences for remarketing
The linking of data goes two ways. If personalized advertising is enabled in Google Ads, you can also use the audience data from Google Analytics to reach the right customers for remarketing. Personalized advertising relies on user interest or behavior data to determine the right audience for ads. If accounts are linked, audiences created in Google Analytics are automatically exported to Google Ads.
Note: To collect session information for users in configured audiences, Google signalsmust also be activated for the Google Analytics 4 property. For the instructions to activate Google signals, refer to the relevant article listed at the end of this reading.
View configured audiences
To view the audiences that have been configured in Google Analytics:
- In the left navigation pane, click the Configure icon.
- Click Audiences.
A list of audiences similar to those shown below will appear.
Audiences screen displays audience names, number of users, percent change, and creation date.
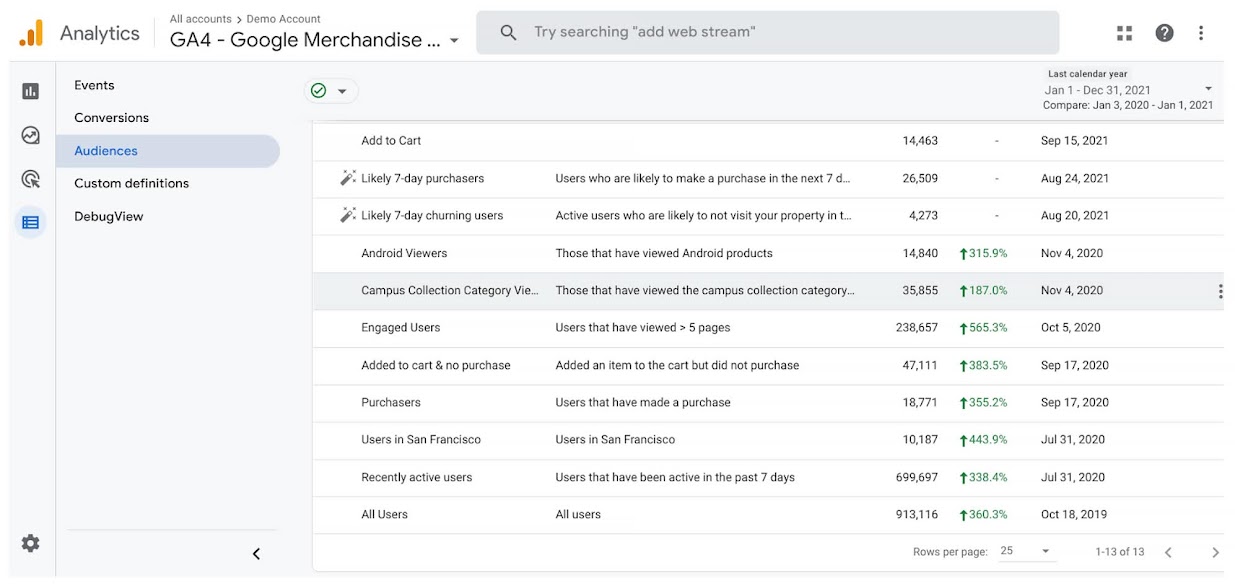
Note: All Users and Purchasers are predefined audiences in Google Analytics. To create a new audience, you must have the Editor role for the GA4 property.
Create a new audience
To create a new audience in Google Analytics:
- In the left navigation pane, click the Configure icon.
- Click Audiences.
- Click New audience.
For an explanation of the settings to configure when you create a new audience, refer to the relevant article listed at the end of this reading.
Key takeaways
Linking data between Google Ads and Google Analytics provides you with better insights about potential customers as they progress through the marketing funnel stages. When audiences configured in Google Analytics are made available in Google Ads, your remarketing ads can also reach the right users more effectively.
Resources for more information
You can refer to the following Google Help articles for more information about linked accounts and data:
- Link Google Ads and Analytics: Describes linking for Google Ads and Google Analytics accounts
- About attribution and attribution modeling: Describes how multiple ads work together on the path to conversions
- About data-driven attribution: Describes the Data-driven attribution model in Google Ads and how to enable it
- Create, edit, and archive audiences: Describes how to create a new audience
- Suggested audiences: Identifies key audiences for retail and e-commerce businesses
- Enable remarketing with Google Analytics data: Describes how to enable Google Ads remarketing using Google Analytics data
- Activate Google signals for Google Analytics 4 properties: Provides instructions to enable Google signals for a Google Analytics 4 property