Some people enjoy digging more deeply into numbers, while others lose interest once numbers are brought up. If you work in the field of performance marketing, you’ll learn to be comfortable using numeric data to make decisions about campaign performance. When you monitor A/B test results for ad variations or bidding strategies in Google Ads, you’re presented with a few statistical results. This reading provides an introduction to these so you’ll be prepared to analyze data from your experiments. Based on the numbers, you can then decide which changes you tested are relevant and beneficial to your campaigns.
Statistics in Google Ads
When you monitor the results of experiments, you’ll encounter the following statistical terms:
- Confidence level
- Confidence interval (derived from a margin of error)
- Statistical significance
Read further to understand what these terms mean and what they tell you about an experiment.
Confidence level
How confident are you in the results of an experiment? For example, a 95% confidence level means that if you were to run the same A/B test 100 times, you would get similar results 95 of those 100 times. A confidence level is normally selected before any data is collected. Most researchers use a 95% confidence level. By default, Google Ads uses this confidence level for experiments. A minimum number of users must participate in a test for that level of confidence to be reached. That’s why you typically run an experiment for at least four weeks—to achieve a result that’s at a 95% confidence level.
Confidence interval (and margin of error)
Because you can’t run a test on an entire population of users, the comparative results of an A/B test is an estimate of the results you would get if you were able to test all users. The margin of error is the statistically calculated difference between the test result and the theoretical result you could have gotten if you had run the test with a lot more users. The confidence interval is the range of possible values after accounting for the margin of error. This range is the test result +/- the margin of error. For example, if your test result is a 5% difference between variations and the margin of error is 2%, the confidence interval would be 3% to 7%. The difference between variations tested could be as low as 3% or as high as 7%. When Google Ads lists an expected range of results, it is reporting the confidence interval.
Statistical significance
Statistical significance is the determination of whether your test result could be due to random chance or not. The greater the significance, the less due to chance. Google Ads performs the statistical calculations at a 95% confidence level in the background and lets you know if a result is statistically significant. A blue star (asterisk) displayed next to a result indicates that there was a statistically significant amount of change between the two variations tested.
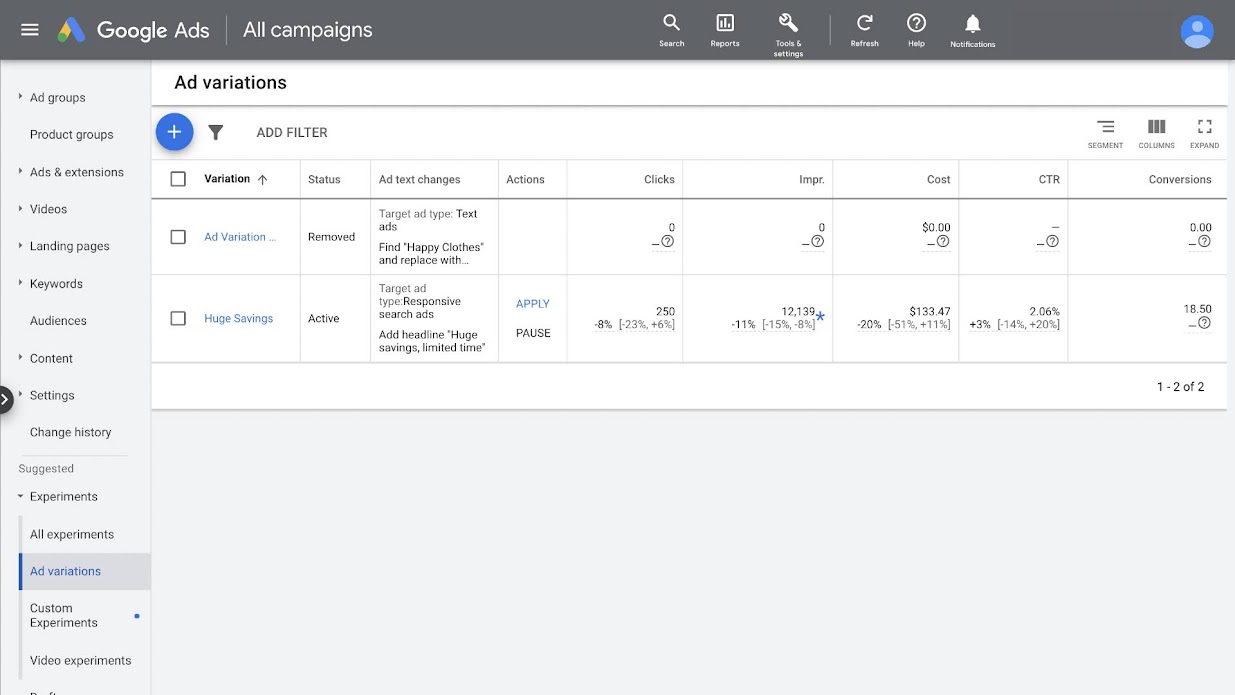
Example from an experiment
As shown below, the Huge Savings ad variation experiment (or A/B test) in Google Ads resulted in fewer clicks and impressions. The number of clicks, 250, was an 8% decrease, while the number of impressions, 12,139, was an 11% decrease. The decrease in the number of impressions was marked with a blue asterisk to indicate that the result was statistically significant at a 95% confidence level. Since both clicks and impressions show a downward trend, you wouldn’t choose to apply this variation to your responsive search ads.
Huge Savings ad variation test results in Google Ads, with a statistically significant result in the Impressions column identified with a blue asterisk.
How long to run an experiment
As mentioned previously, an experiment normally runs for at least four weeks for a good chance at achieving a statistically significant test result. If you need more guidance, many sample size calculators for A/B testing are available online. One such calculator from AB Tasty allows you to enter the average number of daily visitors and the number of variations to calculate a possible duration for a test.
You also need to run an experiment long enough to account for normal swings in e-commerce sales. For example, if it’s normal for your e-commerce business to have the best sales on Sundays and the worst sales on Saturdays, running a test for at least two weeks, and preferably longer, reduces the impact those swings have on your test results. In the same manner, if a sales promotion happens during a test, running the test longer helps prevent that promotion from skewing the test results. If not permitted to run long enough, an ad variation test can appear to perform better than it normally would because a promotion can change user behavior for a few days or weeks.
Resources for more information
Refer to the following links for more information about monitoring your A/B tests for ad variation and bidding strategies in Google Ads:
- Monitor your ad variations: This article describes how to monitor the performance of ad variations and interpret results.
- Monitor your campaign experiments: This article describes how to monitor the performance of a campaign experiment in a scorecard.
To try a sample size calculator for A/B testing that includes a feature to estimate the required duration for a statistically valid test, refer to the following link:
- Sample size calculator: Use this calculator to estimate how many users you need and how long you should run an A/B test.