Reporting a social media campaign’s progress and/or results is an important part of social media marketing. When you properly report your results, your team members and stakeholders will have an understanding of the value that your campaign added to the brand. In this reading, you will learn about the different types of social media reports.
Table of Contents
Types of reports
To ensure all stakeholders get the information they need from your report, there are three types of reports any social media marketer should be knowledgeable about. The best way to provide comprehensive data on every aspect of the campaign is to present each type of report to necessary stakeholders. So, how do you know when to use each type of report? Keep reading for more information on operational, insight, and informative reporting.
Operational reports
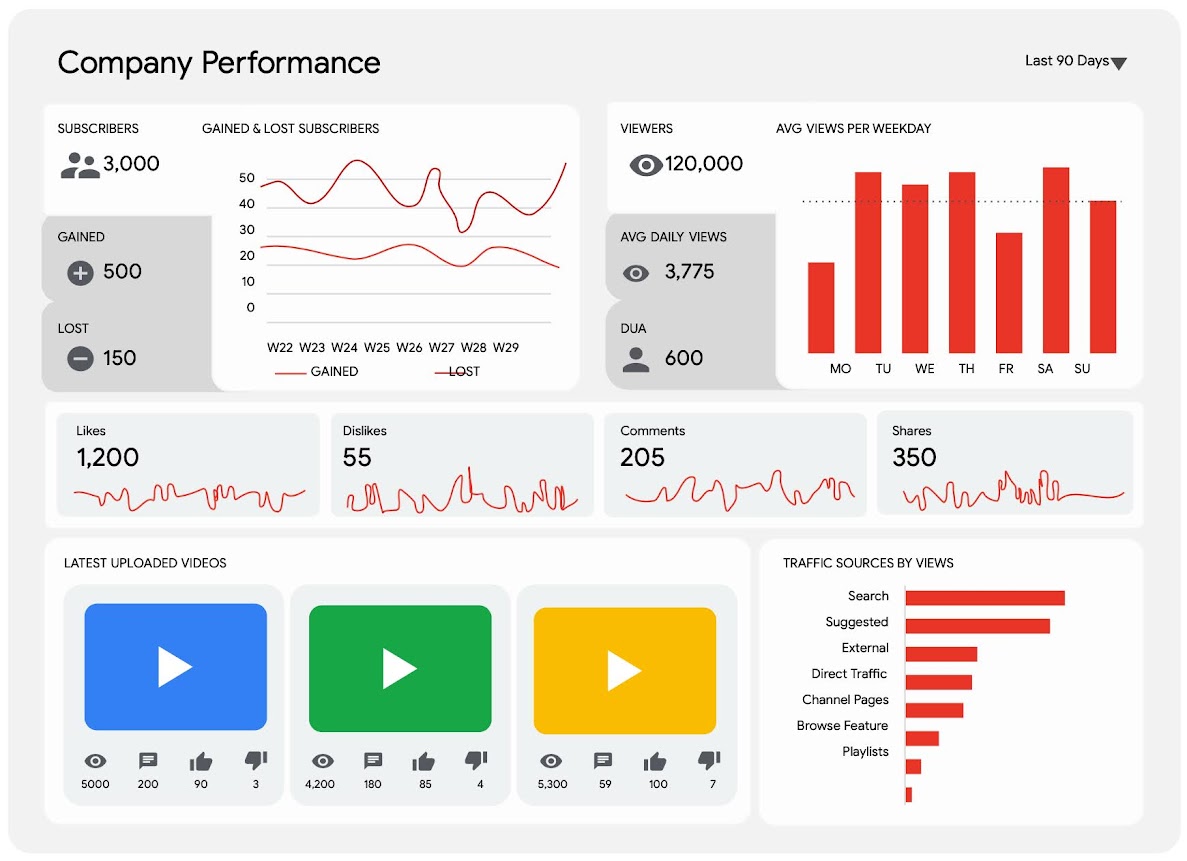
Operational reports give team members real-time updates and information on metrics like audience growth rates, impressions, click-through rates, and more. These reports provide social media marketers with the data they need to track a campaign’s success—and fast—so they can adjust their strategy when necessary.
Mock up example of an operational report.This operational report example features line graphs, bar graphs, numbers, and charts, to demonstrate how the campaign metrics and KPIs were met.
Insight reports
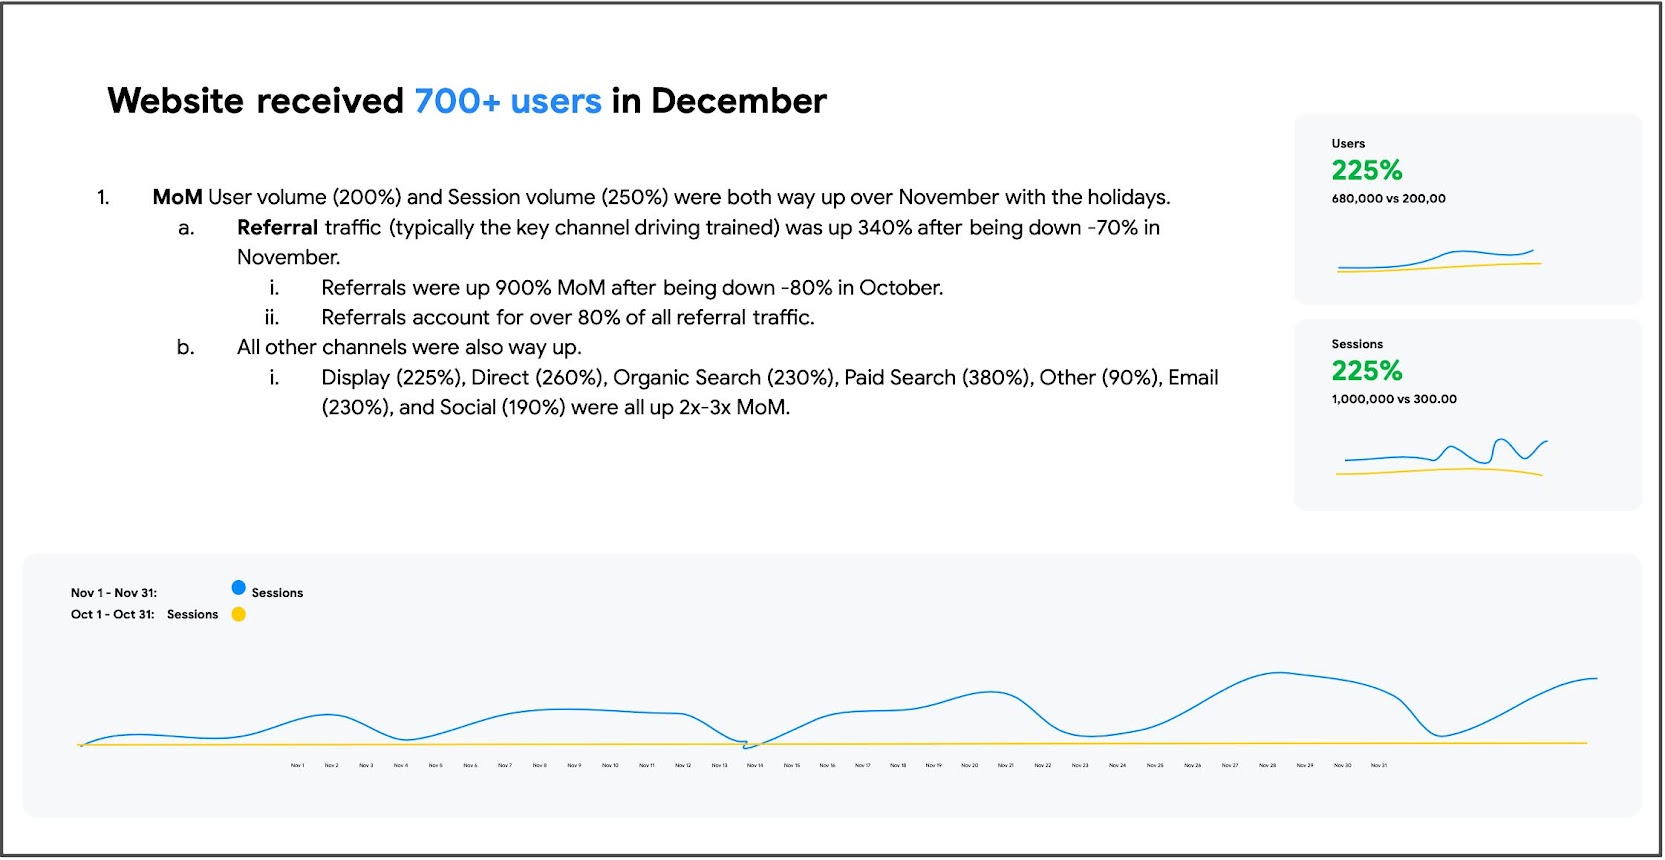
Insight reports offer more than just raw data to your team members and stakeholders—they provide storylines that help explain your campaign. The purpose of insight reporting is to search for meaning in the data and to communicate that meaning at a high-level to stakeholders. These reports answer questions like: why are your click-through rates high? Which social media platforms generate the most leads? Does your audience prefer video-based content or image-based content, and what does that mean for your budget? What trends do you see in the data and why?
Insight report that includes bullet points about site visitors in December and graphs that show website visitor numbers.
Informative reports
Informative reports are mostly used to provide company leadership with a broader understanding of campaign performance. Larger metrics like return on investment (ROI), and other key performance indicators (KPIs) are presented in informative reports because they show the value of campaigns at a high-level. These reports should be very clear and concise, as company leaders may not have a lot of time to analyze insights.

Google Data Studio
If you aren’t sure where to start when it comes to reports, there are tools out there to help you. Google Data Studio helps you leverage data to tell stories by using visualization tools like charts and tables, sharing your insights with team members, and speeding up the report-creating process. It also offers collaborative features so that your team can work together to create reports.
Once you’re in Google Data Studio, all you have to do is search for the different types of reports. To learn more about using templates for reporting, click here.