Using analytics is an important skill for working in e-commerce because it helps you understand how an online store is performing. Earlier, you learned about the analytics and reports available in Shopify. In this reading, you’ll learn more about how to use the features available in the Shopify analytics dashboard.
Basic features in Shopify analytics
Table of Contents
Shopify analytics allows you to access an overview dashboard, reports, and live view. To view the analytics for your mock e-commerce store in Shopify, clickAnalyticsin the navigation menu. Since your e-commerce store isn’t live, there won’t be any data available. However, you’ll still be able to review the metrics and reports available.
Overview dashboard
The overview dashboard provides data about the store’s sales, orders, and online visitors. You can adjust the date range to review data within a specified time range, such as the last quarter or year. You can also compare the data to a previous time period, which allows you to analyze the results quarter-over-quarter or year-over-year.
Overview dashboard for the Bath EcoShop e-commerce store in Shopify

Reports
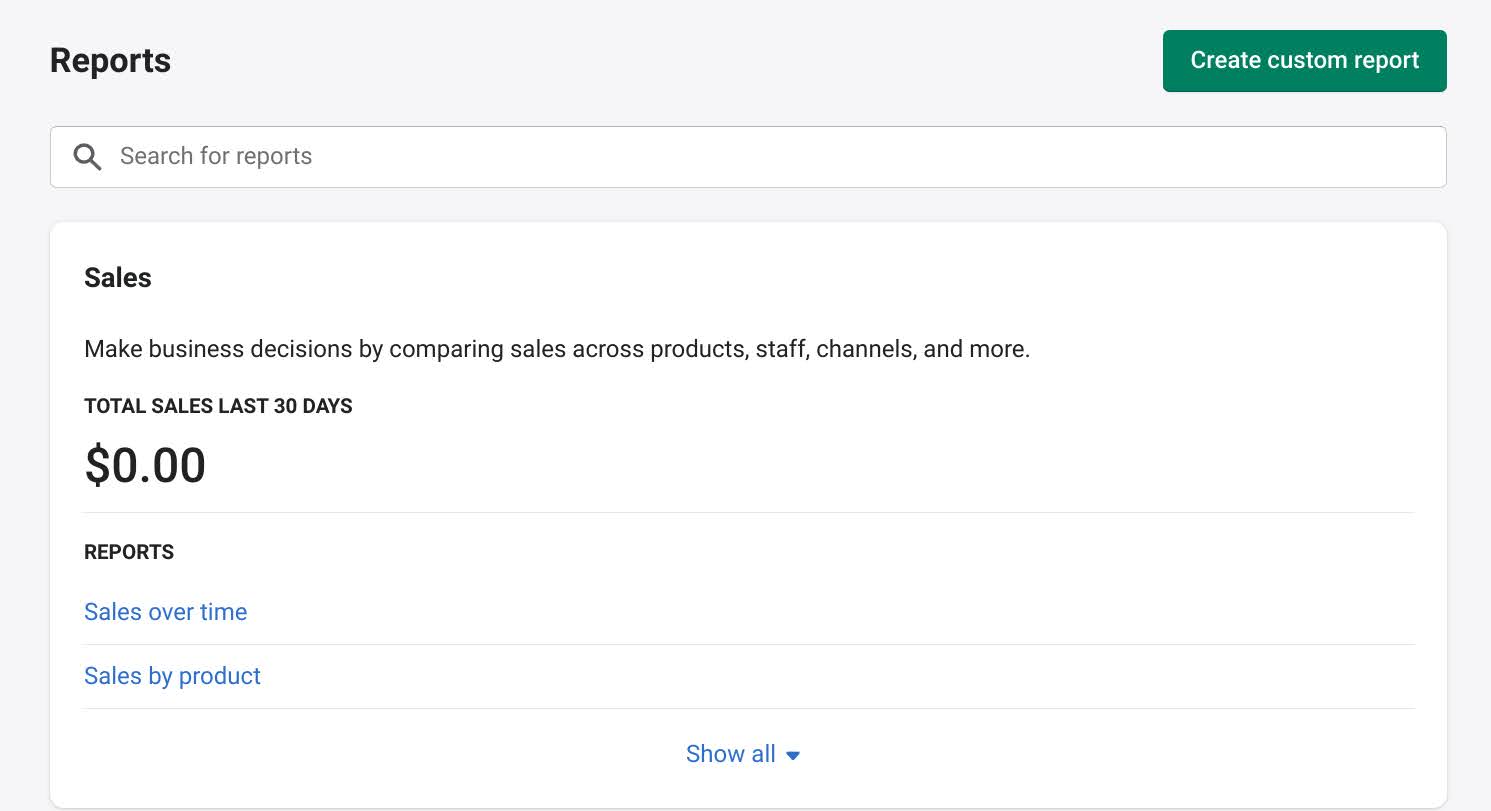
If you want to share analytics data or save it for future reference, you can use the reports feature in Shopify. This feature allows you to print, export, and save reports. Shopify includes built-in reports for analyzing a store’s sales, orders, customers, finances, inventory, marketing, and more. You can also create custom reports that include metrics and data specifically related to your performance goals.
Reports for the Bath EcoShop e-commerce store in Shopify
Live view
The Live View feature in Shopify analytics displays how many visitors are currently in your store and where they are located in the world. It also displays key metrics, such as the total sales and orders received since midnight.
Using Live View can help you monitor activity during high-traffic periods, such as peak times for holiday shopping. It can also help you monitor the results of marketing activities such as limited-time discounts or promotions.
Live view for the Bath EcoShop e-commerce store in Shopify.

Integration with Google Analytics
If you want access to more data, you can integrate your Shopify store with Google Analytics. As you learned in a previous course, Google Analytics gives you access to advanced analytics reporting for your e-commerce store.
Key takeaways
Shopify analytics makes it easy to track the performance of an e-commerce store with a built-in analytics dashboard, reports, and a live view of activity on your site. You can also integrate your e-commerce store with Google Analytics for advanced data tracking and reports.
Resources for more information
Learn more about Shopify analytics and reports by visiting the help center on Shopify’s website.
- Shopify analytics: Learn more about dashboards and reports.