Analytics tools provide insight into what’s working for an e-commerce business and what isn’t. Throughout this program, you’ve learned how businesses can analyze data using spreadsheets and analytics tools. This reading will cover some of the most popular analytics tools used in e-commerce. However, there are many other helpful analytics tools for e-commerce besides the ones mentioned in this reading. As the field of e-commerce continues to change and grow, the list of analytics tools available will continue to change as well.
Google Analytics
Table of Contents
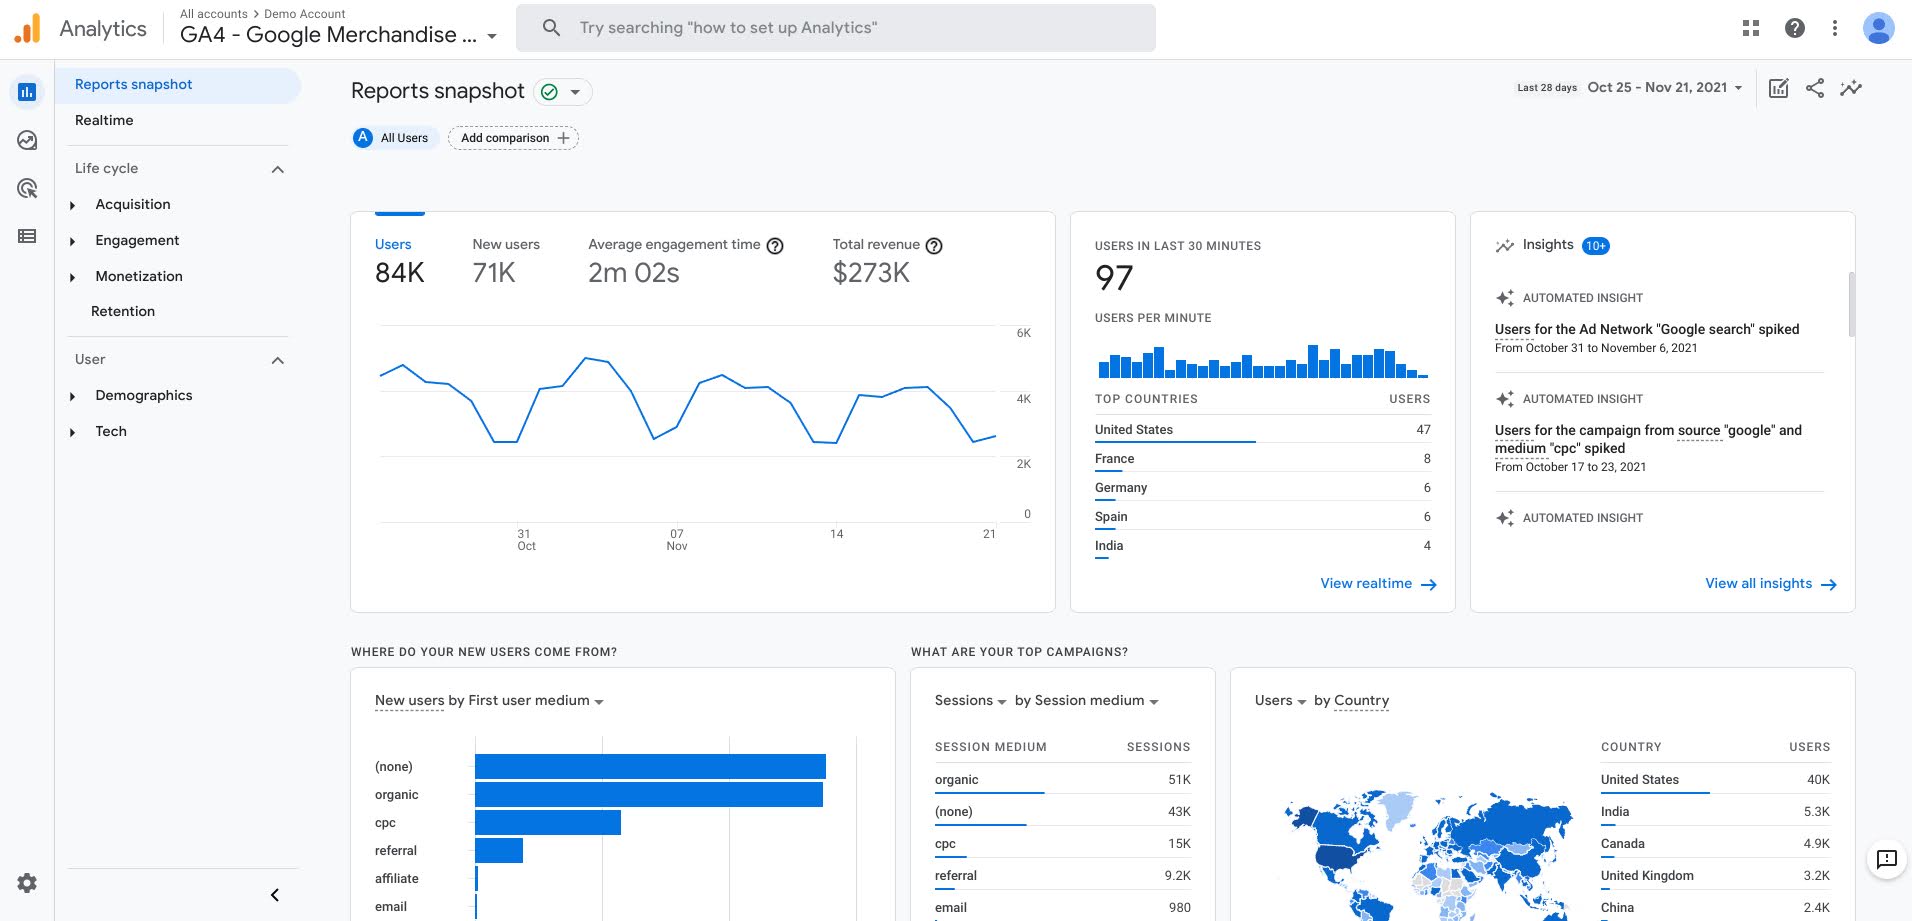
Used by a majority of e-commerce sites, Google Analytics is a web analytics service that tracks and reports website traffic. It offers detailed information about the activity on a website, including the following:
- How many visits the website gets
- Where its traffic comes from
- How visitors engage with the site content
- Which products generate the most revenue
- The total number of conversions and sales
This screenshot demonstrates how the main dashboard in Google Analytics appears:
Shopify analytics
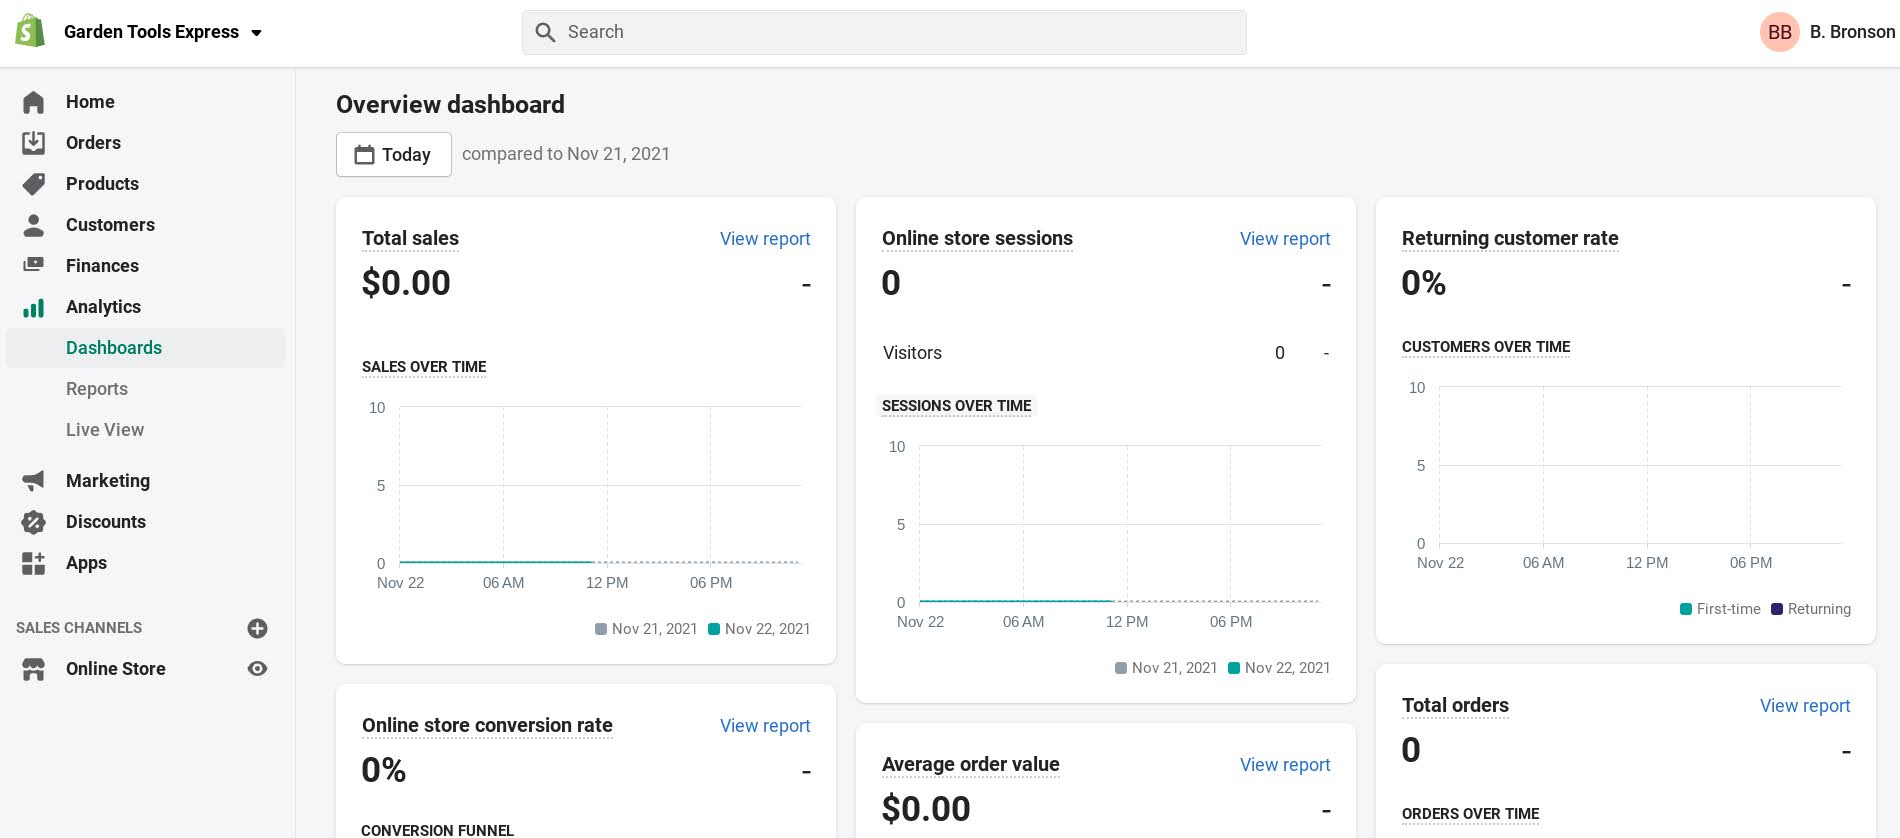
Many e-commerce platforms include their own built-in analytics, including Shopify. Online stores that use Shopify as their e-commerce platform have access to analytics and reports that provide the following information:
- Recent activity in the store
- Insights about the store’s visitors
- Website speed for the store
- Analysis of the store’s transactions
This screenshot demonstrates how the Shopify analytics dashboard appears:
Email marketing analytics
Besides tracking the performance of your e-commerce store, it’s also important to track the performance of your email marketing campaigns.
Google Analytics tracks certain details about your email campaigns, such as how many visitors came to your site by clicking a link in one of your emails. However, you can get more detailed analytics about your email campaigns by using the analytics tool in your email marketing platform, such as Mailchimp or Constant Contact. You may also be able to integrate your email marketing platform with a Customer Relationship Management (CRM) tool, such as HubSpot or Salesforce. This allows you to track analytics from multiple sources in one location.
Email marketing analytics can help you improve your campaigns by providing detailed information, such as the following:
- Open rate: The percentage of users that open your email
- Click-to-open rate: The percentage of email recipients who clicked on one or more links in an email
- Unsubscribe rate: Percentage of email recipients who unsubscribe from your send list after opening an email
- Conversion rate: The percentage of email recipients who clicked on a link in your email and took a desired action, like making a purchase
- Email bounce rate: The percentage of emails sent that could not be delivered to the recipient’s inbox
- Complaint rate: The percentage of complaints recipients send to mailbox providers about receiving your email
Social media analytics
Along with email marketing, it’s also important to track your social media marketing efforts. Social media analytics allows you to track, collect, and analyze data from social media platforms, such as Twitter.
Many social media platforms have built-in analytics tools. You can also analyze your social media marketing across all channels by integrating with an analytics tool like Sprout Social or Hootsuite.
Social media analytics can help you better understand your brand, your audience, and your competitors. It provides information such as the following:
- Brand awareness: Measures the attention your brand received across all social media platforms during a reporting period
- Impressions: The number of times a piece of content is displayed to your target audience
- Potential reach: Measures how many people have potentially seen a post since you published it
- Applause rate: The number of approval actions—such as likes, mentions, retweets, or favorites—that a post receives relative to your total number of followers
- Referrals: The number of times someone was guided to your website from another site
- Conversion: The completion of an activity that contributes to the success of a business
Paid advertising analytics
If you’re running paid ads in search engines or on social media sites, analytics can help you monitor the performance of your advertising campaigns and improve your return on investment.
You can view analytics for your paid ads in the advertising tool itself, such as Google Ads or Twitter Ads. You can also integrate these tools with Google Analytics to view all your data in one place.
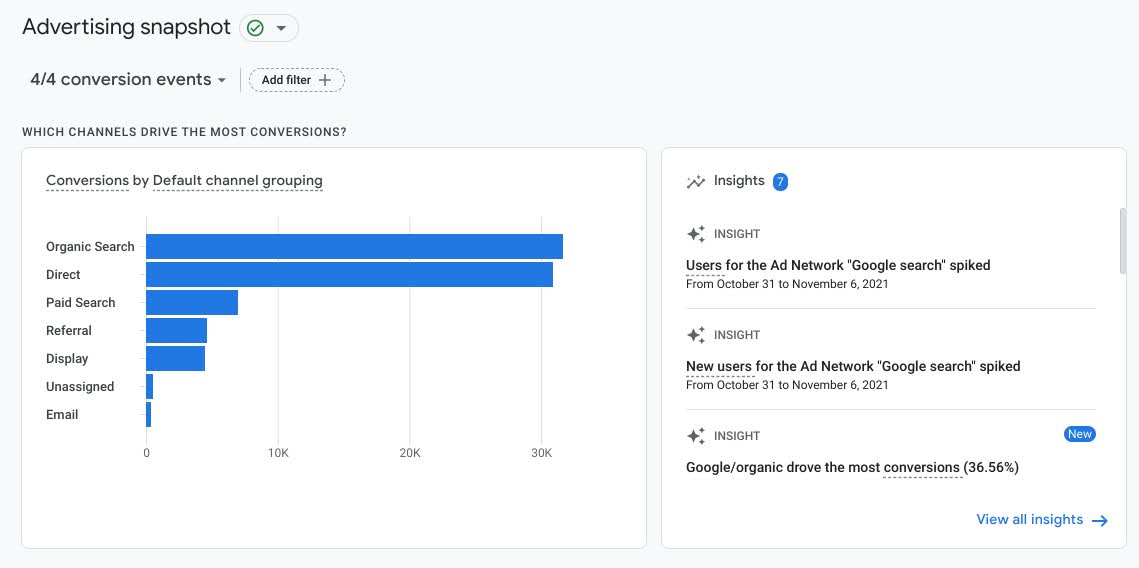
Paid advertising analytics can help you improve your campaigns by providing detailed information, such as the following:
- How many people viewed your ads online
- How many people clicked on your ads
- The number of conversions
- The conversion value per cost
This screenshot demonstrates how the advertising dashboard in Google Analytics appears:
Big data
Most of the analytics tools you learned about in this reading can only handle a certain amount of data. But what if you need access to more data? You’ll need a database that’s designed to store big data.
Big data is the field in analytics that systematically mines and extracts information from very large datasets for insights. Big data is changing what’s possible in e-commerce by allowing marketers to monitor data in real-time and make immediate adjustments to a campaign. Big data also helps marketers use predictive analytics to predict how a webpage or ad will perform.
Here are a few solutions for analyzing big data:
- Structured Query Language (SQL): The standard language used to communicate with databases developed by different vendors and hosted on multiple platforms. SQL queries enable you to pull data from databases for analysis.
- BigQuery: Google’s cloud-based data warehouse solution. It helps you manage and analyze your data with built-in features like machine learning and business intelligence. You can use SQL queries to find data that answers your business questions.
- Python: A programming language that’s become popular for data analysis. It can also be used for data visualization.
Key takeaways
Data analytics provides insight into how your website, marketing campaigns, and paid ads are performing. Using analytics tools, you can monitor data and find ways to improve your website or campaigns.