Monitoring an e-commerce store for growth and revenue is important for the success of any e-commerce business. In a video, you learned some of the most important metrics to monitor for growth and revenue. This reading will review the key metrics you learned and demonstrate how they would appear in an analytics tool. Keep in mind that how a metric appears might differ based on the analytics tool you’re using. Also, not all metrics are available in every analytics tool, and some metrics you may need to calculate using a formula.
Comparing metrics over time
Table of Contents
When it comes to tracking metrics, it’s helpful to compare the results to a previous time period, such as the previous quarter or year. This comparison allows you to measure whether the results are improving over time.
An e-commerce store that’s less than two years old should compare the results quarter-over-quarter. A quarter is a three-month time period based on a company’s financial calendar. Each year includes four quarters.
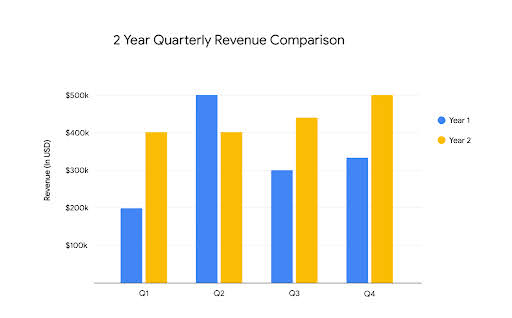
E-commerce stores that have been around for at least two years should measure their results both quarter-over-quarter and year-over-year. The chart below demonstrates an example of how to measure revenue by comparing each quarter to the same time period for the previous year.
Two-year quarterly revenue comparison chart
Traffic and revenue
Attracting more traffic to an e-commerce store is important, because if few people are visiting the store, there will be even fewer sales. However, the type of traffic a store receives makes a big difference. The majority of a store’s traffic should be qualified traffic, which is website traffic made up of visitors who are likely to become customers. If lots of people visit the site but don’t end up making a purchase, that doesn’t help the business grow. Qualified traffic is more likely to lead to a boost in revenue.
Google Analytics makes it easy to discover which types of traffic bring the most visitors and how much revenue each type of traffic generates. The screenshot below demonstrates a quarter-over-quarter comparison of an e-commerce store’s traffic.
Google Analytics dashboard shows a quarter-over-quarter comparison of an e-commerce store’s traffic

The screenshot below demonstrates a quarter-over-quarter comparison of revenue from each type of traffic.
Google Analytics dashboard showing a quarter-over-quarter comparison of revenue based on traffic type

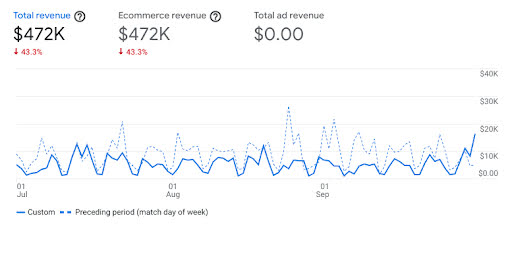
Tracking the total revenue for an e-commerce store is also important. The screenshot below demonstrates how Google Analytics displays the total revenue for an e-commerce store, with a quarter-over-quarter comparison.
Google Analytics dashboard showing a quarter-over-quarter comparison of total revenue
Conversion rate (CVR or CR)
The conversion rate (CVR or CR) is the percentage of users who complete a desired action, such as signing up for a software trial or making a purchase from an apparel retailer. The conversion rate is a key metric to track because it demonstrates whether users are taking actions that contribute to the success of an e-commerce store.
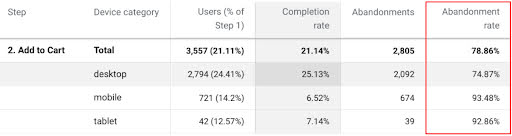
Cart abandonment rate (CAR)
Sometimes visitors add a product to their cart but don’t buy anything. The cart abandonment rate(CAR) measures the percentage of customers who add a product to their shopping cart and leave the store without completing their purchase.
If the company gets the customer’s email address before they leave, they can try to recover lost sales by sending email reminders to these customers.
An increase in the cart abandonment rate might indicate that customers are having issues completing the checkout process.
The screenshot below demonstrates how the cart abandonment rate appears in Google Analytics.
Cart abandonment rate in Google Analytics
Average order value (AOV)
Another key metric to track is the average order value (AOV), which is the average amount of money a customer spends each time they complete an order. A higher average order value can increase a store’s revenue regardless of whether they’re able to acquire new customers or improve their conversion rate.
Cost per acquisition (CPA)
The cost per acquisition (CPA) is the average cost of acquiring a potential customer. It’s important for e-commerce stores to know how much it costs to gain a potential customer, so that they’re not spending more than it’s possible to make in return.
Here is the formula to calculate the cost per acquisition:
Total cost of conversions / Number of conversions = Cost per acquisition
The number of conversions could be the number of email subscriptions added, the number of times a product was added to cart, or another micro-conversion that’s important to the business.
For example, if a company spent $10,000 on campaigns over 90 days for their software product, and 5,000 people added the software product to their cart, the cost per acquisition would be calculated as follows.
10,000 / 5,000 = $2
The cost per acquisition is $2.
Customer acquisition cost (CAC)
The customer acquisition cost (CAC) is the average cost of acquiring a paying customer. Unlike the cost per acquisition, which tracks potential customers, the customer acquisition cost tracks actual paying customers. As with the cost per acquisition, the customer lifetime value needs to be high enough to make up for the cost of acquiring a paying customer.
Here is the formula to calculate the customer acquisition cost:
Total cost of sales and marketing / Number of customers acquired = Cost per acquisition
For example, if a company spent $10,000 on sales and marketing over the last 90 days for their software product, and 2,000 people bought the software product, the customer acquisition cost would be calculated as follows.
10,000 / 2,000 = $5
The cost per customer acquisition is $5.
Customer lifetime value (CLV)
Customer lifetime value (also called lifetime value) is the average revenue generated per customer over a certain period of time. It’s a key metric for companies to track because it helps measure a customer’s loyalty to their brand.
The screenshot below demonstrates how the customer lifetime value appears in Google Analytics.
Lifetime value in Google Analytics

Customer retention rate (CRR)
The customer retention rate (CRR) is the percentage of customers that a company retains over a certain period of time. It’s a key metric for measuring customer loyalty, especially for businesses that rely on recurring purchases or subscriptions. If the retention rate begins to decrease, this could indicate that the company needs to find ways to improve customer satisfaction.
Here is the formula to calculate the customer retention rate:
[(E-N)/S] x 100 = Customer retention rate
E is the number of total customers at the end of a given time period.
N is the number of new customers added within a given time period.
S is the number of existing customers at the start of the time period.
For example, an e-commerce store that sells subscription-based software online might want to measure their customer retention rate over the last three months. At the beginning of the three-month time period, the store had 5,000 customers. During these three months, they added 500 new customers. Three hundred customers canceled their subscriptions during this time period. By the end of the three months, the store had 5,200 customers remaining.
Now you can plug these numbers into the formula.
[(5,200-500)/5,000] x 100 = 94%
The store has a 94% retention rate, which means most of their customers are satisfied.
Key takeaways
Monitoring an e-commerce store’s performance is important because it reveals what’s working and what’s not. Knowing which metrics to monitor can help you discover how to improve the performance of an e-commerce store.