Data is vital to modern marketing, and an effective measurement strategy empowers brands with the information they need for long-term customer engagement. But knowing exactly what to do with the data makes all the difference. How can brands leverage data to identify customer needs and deliver powerful campaigns with real value?

Key Measurements for Successful Customer Engagement
Braze has compiled a comprehensive guide to help brands tackle a measurement strategy that goes beyond one-off metrics. Read this article to learn what to track, what to measure, and how it can drive business growth.
In this article, you’ll discover:
- The 4 stages of measurement and what to measure in each stage
- How to identify high-value actions and optimize them
- How to transform data from customer behavior into a more relevant messaging strategy
- Key measurement steps every brand needs to take and avoid
Table of Contents
Table of contents
Introduction: There’s More to Measurement Than Just Data Collection
Stage One: Measuring Performance
Stage Two: Thinking About the Customer
Stage Three: Understanding the Customer
Stage Four: Driving Customer Value
Conclusion: Key Measurement Steps to Take (and Pitfalls to Avoid)
Introduction: There’s More to Measurement Than Just Data Collection
At this point, everyone knows that data is essential to modern marketing. But while companies around the world are investing in new marketing technologies and stacks and focusing on gathering and managing data in connection with their customer engagement efforts, they often find that these investments in time and resources don’t accomplish much. One of the biggest challenges they face? Knowing what to track, what to measure, and what impact understanding measurement holistically can have on their marketing strategy.
An effective measurement program gives brands information to understand the efficacy of their customer engagement program and to iterate and improve upon it successfully. Companies that aren’t measuring the right things run the risk of optimizing for the wrong things or falling victim to so-called “blind marketing,” where the campaigns you run and the things you measure are totally divorced from the way customers actually interact with your brand.
“Data makes effective customer engagement possible, but leveraging data without context is like trying to understand distance when you’ve got the number but no unit of measurement—it just doesn’t work.” — Adam Biehler, VP, Sales, mParticle
It’s possible to measure practically anything when it comes to customer engagement. But effective measurement is focused on assessing how your marketing efforts and brand experiences are impacting your customers and their engagement with your brand— that is, customer and business health, respectively. These may not be the only things you track, of course, but if you’re not measuring these elements, it’s almost impossible to succeed over the long haul.
That means that while key metrics (e.g. revenue, lifetime value) are important, true optimization is only possible if you focus your measurement efforts on your customers. If, for instance, you know that revenue has increased but aren’t clear why, you’ll struggle to adjust and optimize your overall marketing strategy to drive better outcomes for customers—and your business as a whole.
In this article, we’ll walk you through the four stages of measurement, explore what you can measure in each stage, and the impact that your measurement stage can have on your customer engagement efforts and overall business. But whatever stage you may find yourself in, remember that holistic data collection and measurement— rather than one-off metrics—is the end goal.
How to Categorize Measurement: Input vs. Output Metrics
Before you can put together a measurement strategy that works, you need to make sure you’re looking at both sides of the equation. Many brands fail to distinguish between output metrics (that is, top-line numbers like revenue) and input metrics (i.e. the more granular statistics that inform output metrics). If you measure performance and company health based on output metrics, you can easily come away with an incomplete picture of your performance—and that missing context can come back to haunt you.

How to Categorize Measurement: Input vs. Output Metrics
Stage One: Measuring Performance
This is where it starts for most brands. At this initial stage of measurement, the data and metrics you have on hand tend to be as general and generic as they get. You may have a sense that things are moving in the right (or wrong!) direction, but you don’t have enough information to drill down into any of these metrics to understand them more deeply.
While the metrics you can gather at this stage can be directionally helpful, it’s common to find that you’re creating campaigns that aren’t delivering true customer or business value. The campaigns may be smart or memorable, but they’re not based on customer behavior—because you aren’t gathering the kind of information on customers’ interactions and preferences that would allow for that kind of nuance.
The upshot? You’re unable to adjust your campaigns in a way that would allow you to respond to signals from your users. For instance, any onboarding program you’d build at this stage would be targeted at your whole audience, rather than adjusting based on how users engaged with it as they moved through the flow.
Stage One, In a Nutshell: If you have a 10% email open rate and you can’t dig into the difference between your transactional and promotional email open rates, you’re at this stage.
Common Metrics Measured During Stage One
- Engagement: Open and Clickthrough Rates Across Email and Mobile Messaging Channels (e.g. push, SMS). You know that people are opening and clicking, but you can’t dig into any nuance around that engagement
- Retention: N/A. At this measurement stage, many companies are unable to measure their user retention rates accurately, making it difficult to assess customer health
- Customer Value (Health): Historical Revenue. You may know how much revenue your brands drove last quarter, but that’s as deep as your tracking can go at this stage
- The total number of orders (input metric/ retention): High-level metric that can inform growth or decline of revenue.
- Conversion rate (output metric): Often designed around vanity metrics like open and clickthrough rates in this stage, versus more tangible business outcomes and company-specific goals.
- User Counts (input metric/output metric): This can be an output metric for acquisition efforts or an input metric for higher-level retention and revenue metrics.
Common Stage One Tech Stack Components
- Messaging: Basic ESP or customer engagement platform
- Analytics: Web analytics solution (e.g. Google Analytics)
Common Stage One Tech Stack Components
VALUE LEVEL: BATCH AND BLAST
In general, companies in stage one are unable to do any substantive testing. This often leads marketers to take a set-it-and-forget-it approach to customer engagement because they find it too difficult to assess the impact of their marketing efforts in a cohesive way. Also, because they’re unable to dig into the details of customer behavior, brands at this stage often carry out customer engagement strategies that treat every member of their audience as a part of a homogenous whole.
If you’re looking to move the needle on your high-level metrics, you’ll likely need to do so on a campaign-by-campaign level. Why? Because you don’t have enough information on hand to accurately assess your marketing results and engagement strategy holistically.
Stage Two: Thinking About the Customer
At this measurement stage, businesses can take their metrics a level deeper: You’re likely able to distinguish some differences between groups and between customers; you’re creating broad customer segments to allow for simple message targeting, and you’re beginning to dig deeper into how your customer is engaging with your brand and what you can do to deepen that connection.
The upshot? You can take some tentative steps to improve the customer experience, but the impact you’re going to see will still primarily be high-level. Because your overall approach isn’t driven by user behaviors and actions, the targeted outreach you’re capable of sending may be somewhat basic—for instance, sending different campaigns to new and existing customers.
Stage Two, In a Nutshell: If you’re able to send onboarding campaigns because you can tell which customers are new, but can’t actually customize those campaigns to fit different types of new users, you’re at this stage.
Common Metrics Measured During Stage Two
- Engagement by Message Type: You’ve got a sense of what engagement looks like for your brand’s different campaign types (transactional vs. promotional vs. lifecycle) and where you may be under-or overperforming
- Retention: Percentage of Customers Retained Over X Period. At this measurement stage, you’re beginning to get a high-level picture of user retention and can tell if a lapsed customer churned last week, last month, or last year
- Customer Lifetime Value (CLV): You’ve moved beyond just tracking overall revenue and can now see how much revenue you’ve received from individual customers to date, allowing you to start assessing which audience segments are driving your business results
- Customer Acquisition Costs (CAC). You’re now able to assess how much it costs you on average to acquire a new customer, though you may still be struggling to synthesize acquisition and retention data overseen by different teams across different parts of the customer lifecycle
- An average number of basket items (input metric): This metric lets you know whether customers are purchasing more items from your brand.
- Average basket value (input metric & output metric): This is an input metric for broader revenue analysis; however it can also be an output metric for teams focused on boosting average order value by encouraging users to add an increased number of items or higher value items.
- Order frequency (input metric & output metric): This is an input metric for broader revenue analysis, but also a potential output metric for customer engagement efforts.
Common Stage Two Tech Stack Components
- Messaging: Basic ESP or customer engagement platform
- Analytics: Web analytics solution (e.g. Google Analytics)

Common Stage Two Tech Stack Components
VALUE LEVEL: BASIC PERSONALIZATION
At this stage, you likely have introductory targeting (e.g. a generic abandoned cart message) and personalization (add the first name, etc.), but you’re not in a position to really optimize. Campaigns are either slightly customized or not customized at all and you don’t have a true picture of what user engagement with your brand’s digital properties really looks like.
Your brand’s new capabilities are certainly beneficial and will provide a better user experience than sending the kinds of generic batch and blast campaigns you depended on before. However, you’re still not on par with brands that have developed highly-engaging, personalized customer experiences honed by ongoing campaign testing and experimentation—which means that you’re running the risk of alienating customers who have interacted with brands at that level and have come to expect more.
Stage Three: Understanding the Customer
At this measurement stage, you’re beginning to have access to a deeper level of insight around user actions, behavior, segments, and lifecycle stages. This allows you to see a clearer picture of individual user behaviors and preferences, making it possible to use that more accurate, more up-to-date look at what’s resonating with customers (and what isn’t) to carry out tests on your campaigns and begin optimizing results.
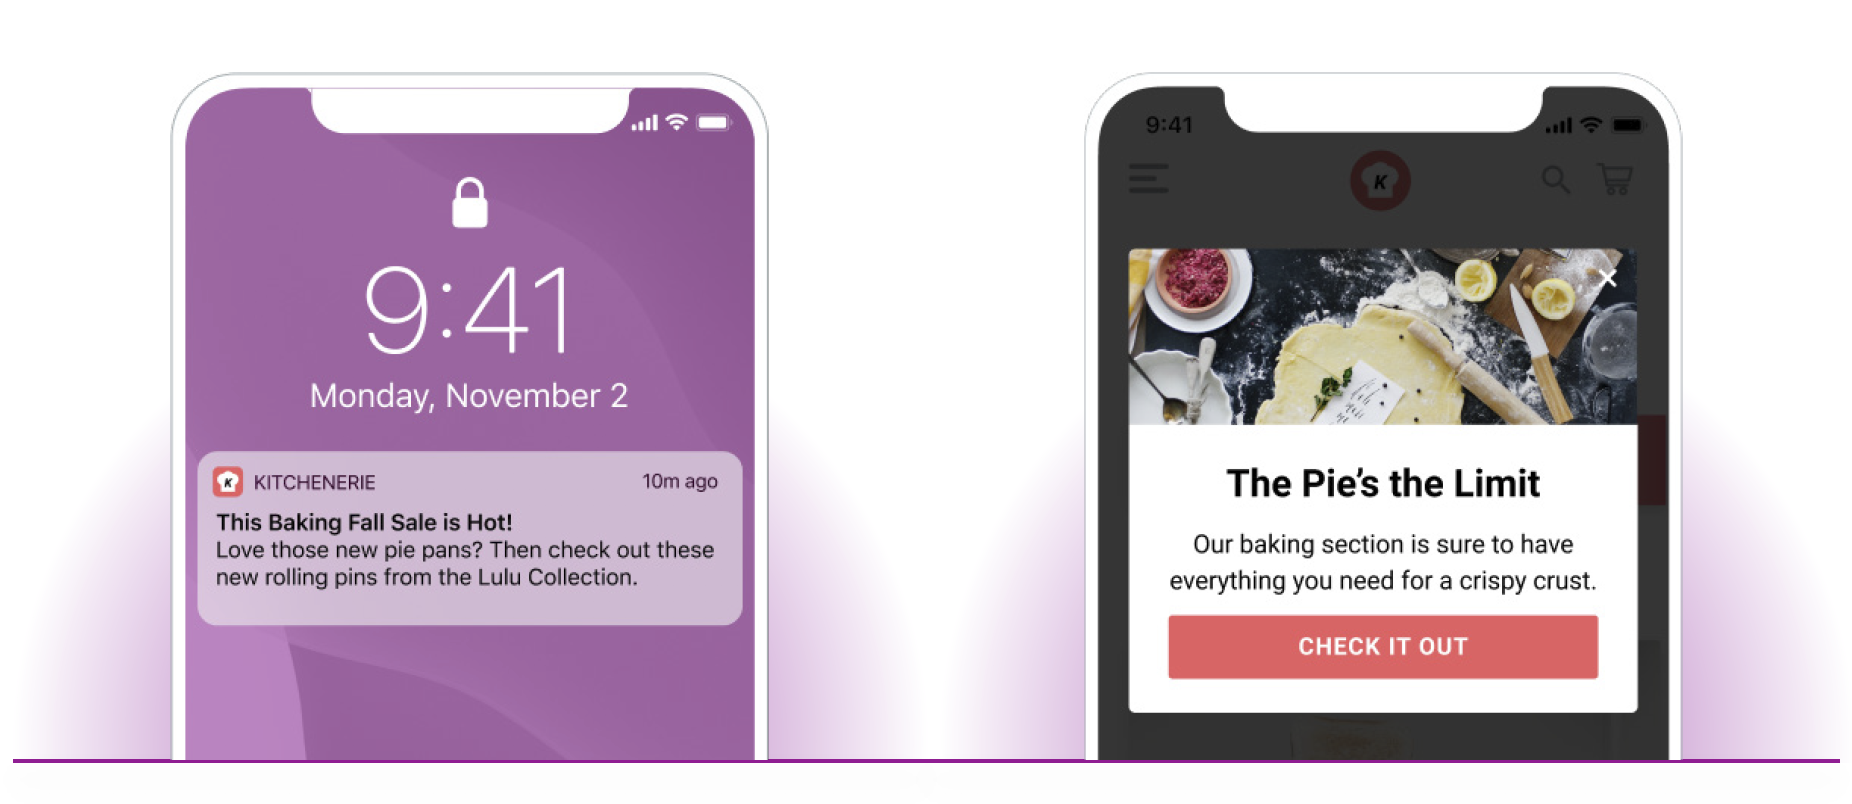
The upshot? You’re now in a position to build your customer engagement strategy around insights powered by your users’ first-party customer data, supporting a more timely, relevant messaging experience in any channel that you leverage.
Stage Three, In a Nutshell: If you’re able to send onboarding campaigns that include specific, personalized call-outs regarding the items or products a given user has shown interest in, you’re at this stage.
Common Metrics Measured During Stage Three
- Engagement: Message and App/Website Engagement Rates by Customer Segment (e.g. true segment or customer lifecycle segment). You know not just that new users open xx% of emails, but also how more targeted groups of users differ in their engagement patterns and behavior
- Retention: Retention by Customer Segment. At this measurement stage, you know not just how many (or what percentage of) total customers were retained in a given period, but also how retention differs for different segments that may be based on user behaviors or actions
- The Ratio Between CAC and CLV Over Time: You’re beginning to measure how healthy your customer relationships are by assessing how your customer acquisition costs stack up to the money each of these new customers is adding to your bottom line—ideally, you’ll be in the black or have a path to get there
- Percentage of customers moving between different levels of the customer journey (input metric): This metric provides insight into the dropoff points and rates between stages like email capture and first purchase.
- Order frequency by segment (input metric & output metric): This input metric helps identify the purchase behavior of various customer segments and how each segment impacts the macro purchase and revenue metrics. As an output metric, this may inform some of your customer engagement and marketing efforts.
- Product consumption by geo (input metric/revenue; output metric/ acquisition): Another value that is both an input and output metric dependent on what is being analyzed.
Common Stage Three Tech Stack Components
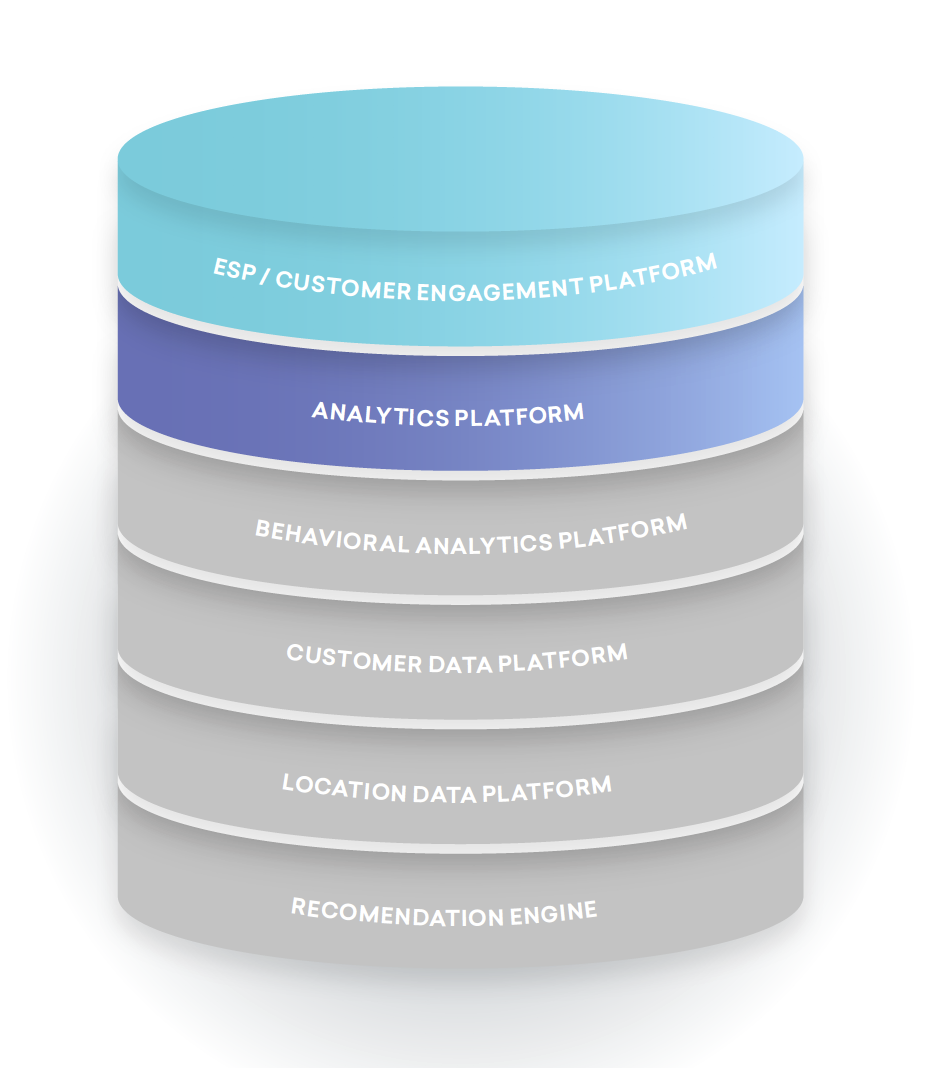
- Messaging: Advanced customer engagement platform
- Analytics: Web analytics solution (e.g. Google Analytics) and behavioral analytics platform (e.g. Amplitude, Mixpanel)
- Data Connector: Customer Data Platform (e.g. Segment, mParticle, Tealium)
- Location Insights: Location Data Platform (e.g. Radar, Foursquare)
- Recommendations: Recommendation Engine (e.g. Amazon Personalize)

Common Stage Three Tech Stack Components
VALUE LEVEL: ADVANCED PERSONALIZATION
At this stage, your measurement sophistication has reached the point that increasingly customer-centric approaches to marketing—powered by advanced segmentation and personalization—are now achievable, making significant increases in customer and business value possible. Not all of your campaigns may be driven by customer actions and behaviors at the moment, but you’re likely regularly using these actions to inform smarter, more effective outreach to your users.
In general, this is the stage where you move from acting on hunches about what the customer wants to actually listen to each customers’ unique signals and patterns—their “body language,” if you will—and then serving up experiences that speak to the needs and wants they’re telegraphing. That represents a major shift in how your brand is approaching customer engagement, from a strategy built around intuition and incomplete insights to one driven primarily by customer actions.
Drive Downstream Impact with High-Value Actions
Understanding user behavior is the cornerstone of modern marketing— but the truth is, some of those behaviors impact your bottom line far more than others. For most companies, a small number of so-called “high-value actions” (HVAs) are uniquely connected to their value proposition, and successfully nudging users to carry out these steps while interacting with your brand can have a disproportionately positive impact on business results. In general, once a user completes an HVA, they have a much stronger likelihood of driving higher value for your brand, compared to a user who hasn’t carried out that action.
HVAs Can Impact The Full Customer Journey:
- Activation
- Retention
- Monetization
If understood and encouraged effectively, HVAs can help brands maximize the value that each customer represents to their business during the early stages of the user lifecycle—and then help maintain those engagement levels over the long haul.
To measure HVAs, you need:
- A Goal: “I want to increase customer value and revenue”
- A Hypothesis: “I think people who download our app are more valuable”
- Validation: “Our metrics show that a customer who downloads the app spends 1.4x as much as those who only engage on the web”
Once you’ve determined the HVAs that matter to your business, you can focus your testing and optimization efforts on finding ways to drive more users to complete that action.
Stage Three: This is when HVAs kick into high gear
While you may have begun identifying possible HVAs for your business in earlier measurement stages, this is likely where your measurement sophistication has reached the point that you can begin to introduce HVAs effectively into your customer engagement strategy.
Why here? Because identifying HVAs and encouraging users to carry them out requires a nuanced understanding of what every customer is doing and what those actions mean for your business. For instance, once you can tell that a customer who purchases in 2+ categories has a 1.5x higher CLV, you can begin optimizing toward that HVA to improve the overall health of your customer base.
Stage Three: This is when HVAs kick into high gear
Stage Four: Optimizing for Your Most Impactful HVAs
At this measurement stage, you’ll find that the HVAs your customer engagement efforts are focused on are no longer fuzzy or anecdotal—you’ve quantified them and you can accurately assess the effort it takes to drive them, as well as the uplift associated with each customer who carries them out. Besides, you can now carry out coordinated planning on an ongoing basis to ensure that you’re prioritizing the right HVAs for your unique audience and business goals.
At this point, you can see which one of your HVAs is moving the needle the most against your core goals. While you can still create tests and experiments on how to drive the other HVAs, you should now have enough information and data to prioritize the HVA that will have the highest impact.

Stage Four: Optimizing for Your Most Impactful HVAs
What does this kind of optimization look like in practice? Imagine your brand has identified and quantified three HVAs associated with your customer engagement program:
- Web vs. Mobile App Users: App users have a CLV that is 1.4x higher than those who only engage on the web
- Purchases in Multiple Categories: The CLV of customers who purchase in multiple product categories (e.g. apparel and beauty) is 2.3x higher than those who purchase in a single category only
- Purchases Across Platforms: The CLV of customers who purchase both in-store and on mobile is 3.1x higher than those who only purchase through one platform
What does this tell us? While all three HVAs represent an opportunity to improve a users’ value to your brand, HVA #3 packs a bigger punch than the other two, allowing your brand to focus on optimizing your customer engagement strategy to drive that particular action to more effectively hit your goals.
Stage Four: Driving Customer Value
At this measurement stage, you finally have both a vivid macro image of how your brand is performing when it comes to your customer engagement efforts and a nuanced, detailed understanding of the micro-elements that ladder up to those top-level results. Even better, you’re now able to move seamlessly between these two distinct levels to understand and iterate on your marketing campaigns to optimize your customer relationships and the health of your business.
The upshot? You’re now in a position to look at top-level metrics to see directional trends, while also being able to dig deeper and deeper with the click of a button to see a more nuanced picture.
Stage Four, In a Nutshell: If you’re able to accurately assess each customer’s CLV and then seamlessly zoom in to tweak the various factors influencing that stat to ensure the strongest possible top-line performance, you’re at this stage.
Common Metrics Measured During Stage Four
- Engagement: The Full Picture of User Engagement With Each Messaging Channel
- Web: web push, in-browser messages, web Content Cards
- Mobile: push notifications, in-app messages, SMS, Content Cards
- You have a rich understanding of how your users are interacting with your brand across email, mobile, and the web, and can make strategic decisions based on that understanding—for instance, does mobile increasingly appear to be a strong sales channel for users, allowing you to drive business effectively via your app, or does the data at your disposal suggest that users see it as a primarily transactional channel?
- Retention: Cohort Retention. At this measurement stage, you understand how your brand’s daily/weekly/ monthly retention is trending over time, as well as what those trends look like across segments and lifecycle stages
- The Ratio Between CAC and CLV Over Time by Segment and Cohort: You can now understand how your acquisition costs and revenue per customer metrics manifest across different behavioral groups and time-based cohorts
- CAC Payback Period Over Time by Segment and Cohort: You’re now tracking how long it takes for your customers’ value—by segment and cohort—to exceed their acquisition cost, helping you to understand the profitability of various segments…and whether your customers are becoming more profitable over time
- Customer stickiness (output metric): This metric is typically measured as a ratio of daily or weekly active users to monthly active users, gauging the intensity of customer engagement.
- Upsell rate / Add-on value (input metric): Stemming from selling additional products/services to the customer, this is a metric that informs broader revenue measurements.
- CLV by channel (input metric): This metric ladders up to higher-level customer value metrics by digging into the varying levels of CLV based on channel engagement (e.g., web-only customers, mobile-only customers, web and mobile customers).
Data Agility: What’s Needed to Take It to the Next Level
Much like the transition between stage one and stage two, the difference between stage three and four isn’t primarily about the technology at your disposal; it’s about having the right mindset and focusing on things that will have the maximum impact on your business.
Brands generally won’t be able to evolve from stage three to stage four if they have data silos or serious latency issues impacting the ability of the different layers of their tech stack to communicate in real-time. To support the kind of in-the-moment insights, testing, and optimization that this measurement stage depends on, brands need to ensure they’ve assembled a stack built around streaming data and that their data collection and management practices allow for truly responsive measurement and iteration.
Common Stage Three Tech Stack Components
- Messaging: Advanced customer engagement platform
- Analytics: Web analytics solution (e.g. Google Analytics) and behavioral analytics platform (e.g. Amplitude, Mixpanel)
- Data Connector: Customer Data Platform (e.g. Segment, mParticle, Tealium)
- Location Insights: Location Data Platform (e.g. Radar, Foursquare)
- Recommendations: Recommendation Engine (e.g. Amazon Personalize)

Common Stage Three Tech Stack Compon
VALUE LEVEL: TRULY CUSTOMER-FOCUSED, CUSTOMER-DRIVEN ENGAGEMENT
At this stage, your measurement sophistication is best in class, allowing your company to have unparalleled insight into the customer engagement patterns, trends, and HVAs that truly move your business—from the biggest output metric to the smallest input one. This understanding should extend across acquisition, engagement, retention, and monetization, allowing your brand to effectively prioritize the right HVAs for your business needs right now.
When you spot macro trends within your business at this stage, there should no longer be a question mark about what’s happening and why—you know and can stay on top of what elements of your work are influencing these shifts and then adjust your strategy accordingly across all your owned/earned/ paid channels and platforms.
Conclusion: Key Measurement Steps to Take (and Pitfalls to Avoid)
Avoiding Measurement Silos—How to Ensure a Holistic View Measurement isn’t just about having the right data; it’s also about having the communication and collaboration you need between different teams and different layers of your tech stack to be able to pull the relevant information together in useful, meaningful ways to drive real insight and action.
When it comes to your technology stack, there’s no denying that assembling a best-in-class ecosystem built on streaming data is key. But if you’re not thinking about how the customer is being holistically engaged across their lifecycle and ensuring true partnership between all the teams who touch that individual’s journey, you’re going to have disconnected experiences, incomplete data, and metrics that you can’t effectively track. By empowering employees, taking the time to fit your organizational structure to your customers’ needs, and paying attention to emerging silos, it’s possible to see better results and strong customer relationships day by day and week by week.
Next Steps—How to Get There From Here
- Begin by prioritizing new solutions based on their direct impact on your customers—that is, can this particular platform or software measurably support a better customer experience?—and wean yourself off technologies that can’t operate in-the-moment to support timely, personalized brand experiences. Over time, you’ll be laying the foundation for a better measurement regime and stronger customer engagement outcomes.
- Consider starting with a gap analysis to help your organization understand what measurement stage you’re at today. Assess what metrics you’re currently measuring, and what new metrics and analysis would help you take the next step toward improving the overall health of your customer relationships and your business outcomes.
- As you begin this journey, take the time to think through what will shift when the metrics you need are at your fingertips—how will that change your campaign strategy, your team silos, your customer relationships, and more? It’s not a one-and-done thing: Making progress along this journey requires care and thought. To use any metrics effectively, you’ll need to plan and ensure that your organization is ready to leverage new data, metrics, and insight as they become available, to ensure more effective customer engagement efforts on an ongoing basis.
Source: Braze